Lightweight SIEM with Wazuh and OPNsense: Centralize and Correlate All Stack Logs
Deploy a lightweight SIEM with Wazuh on Proxmox: centralize Suricata, CrowdSec, AdGuard Home, fail2ban logs and create correlation rules to detect multi-stage attacks.
Why a SIEM? The Isolated Tools Problem
On an infrastructure without a SIEM, you have alerts everywhere — Suricata detects a scan, CrowdSec blocks an IP, fail2ban denies an SSH attempt — but no one connects these events. A coordinated attack can unfold over 3 hours across 5 different tools without you ever seeing the complete attack sequence.
A SIEM (Security Information and Event Management) solves exactly that: it collects logs from all sources, normalizes them, correlates them, and fires an alert when an attack pattern emerges. It's the difference between having security cameras in every room and having a security officer watching all the screens simultaneously.
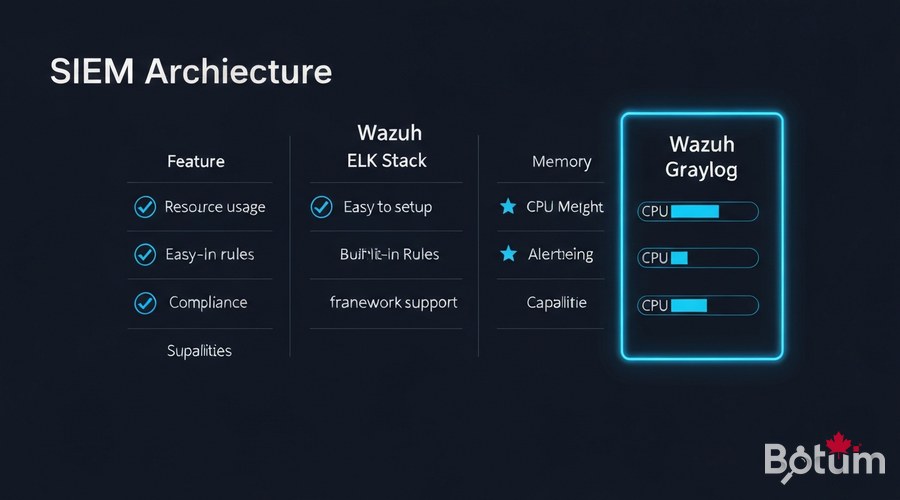
Wazuh vs ELK Stack vs Graylog
I evaluated three options for this stack:
- ELK Stack: powerful and flexible, but RAM-hungry (8-16 GB minimum) and requires building all rules manually.
- Graylog: good interface, lighter than ELK, but correlation rules are limited in the free version.
- Wazuh: lightweight (4 GB RAM), 2000+ built-in detection rules, native FreeBSD agent for OPNsense, PCI DSS / CIS compliance built-in, and dashboard included. My choice.
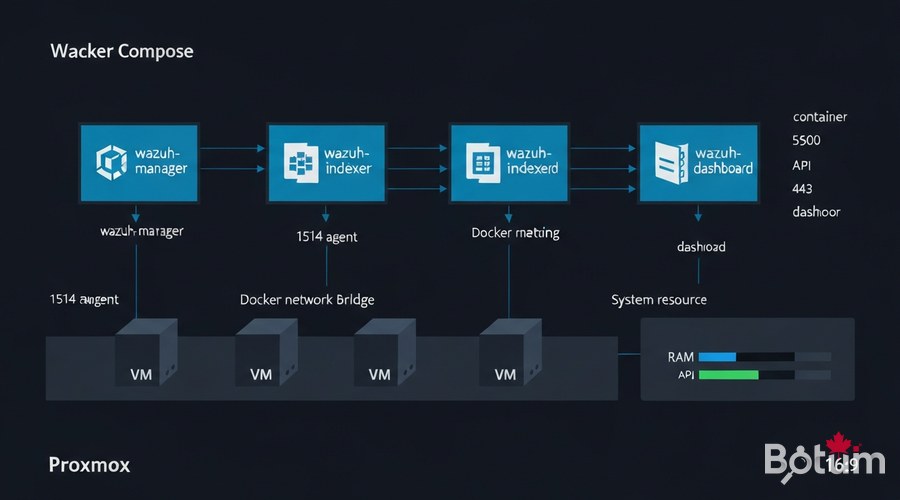
Install Wazuh in Docker on Proxmox
I deploy Wazuh on a dedicated Proxmox VM: 2 vCPU, 4 GB RAM, 40 GB SSD. The official Docker Compose stack includes three containers:
- wazuh-manager: the correlation and log analysis engine
- wazuh-indexer: OpenSearch (Elasticsearch fork) for storing and indexing alerts
- wazuh-dashboard: web interface (port 443)
# Proxmox VM — Debian/Ubuntu
# Open ports from OPNsense: 1514/UDP, 1515/TCP, 55000/TCP, 443/TCP

mkdir -p /opt/wazuh && cd /opt/wazuh

# Download official docker-compose
curl -sSL https://raw.githubusercontent.com/wazuh/wazuh-docker/v4.9.2/single-node/docker-compose.yml      -o docker-compose.yml

# Generate internal SSL certificates
docker compose -f generate-indexer-certs.yml run --rm generator

# Start the full stack
docker compose up -d

# Verify
docker compose ps
# wazuh-manager   Up   0.0.0.0:1514->1514/udp, 1515/tcp, 55000/tcp
# wazuh-indexer   Up   9200/tcp
# wazuh-dashboard Up   0.0.0.0:443->5601/tcp
Access the dashboard at https://PROXMOX-IP with default credentials admin / SecretPassword — change immediately.
Deploy the Wazuh Agent on OPNsense
OPNsense runs on FreeBSD — the Wazuh FreeBSD agent is natively compatible. Install via SSH:
ssh admin@192.168.1.1   # SSH into OPNsense

# Install Wazuh FreeBSD agent
pkg install -y wazuh-agent

# Configure the manager address
sed -i '' 's|<address>MANAGER_IP</address>|<address>192.168.X.X</address>|'     /var/ossec/etc/ossec.conf

# Enable and start
echo 'wazuh_agent_enable="YES"' >> /etc/rc.conf
service wazuh-agent start
ossec.conf configuration on OPNsense
<ossec_config>
  <client>
    <server>
      <address>192.168.X.X</address>
      <port>1514</port>
      <protocol>udp</protocol>
    </server>
    <enrollment>
      <enabled>yes</enabled>
      <manager_address>192.168.X.X</manager_address>
      <port>1515</port>
      <agent_name>opnsense-fw</agent_name>
    </enrollment>
  </client>
  <localfile>
    <log_format>syslog</log_format>
    <location>/var/log/system.log</location>
  </localfile>
  <localfile>
    <log_format>syslog</log_format>
    <location>/var/log/filter.log</location>
  </localfile>
</ossec_config>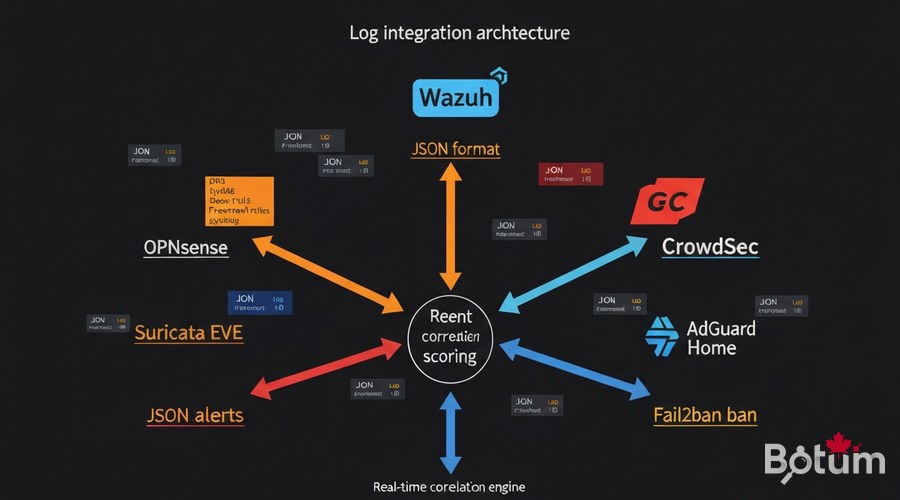
Integrate Logs: Suricata, CrowdSec, AdGuard, fail2ban
Suricata EVE JSON (Episode 7)
<!-- ossec.conf agent OPNsense -->
<localfile>
  <log_format>json</log_format>
  <location>/var/log/suricata/eve.json</location>
  <label key="source">suricata</label>
</localfile>
CrowdSec (Episode 5)
<localfile>
  <log_format>json</log_format>
  <location>/var/log/crowdsec.log</location>
  <label key="source">crowdsec</label>
</localfile>

# CrowdSec webhook → Wazuh API:
# /etc/crowdsec/notifications/http.yaml
type: http
name: wazuh_notifier
url: http://192.168.X.X:55000/
template: |
  {"source":"crowdsec","action":"{{.Decision.Type}}","ip":"{{.Decision.Value}}"}
AdGuard Home (Episode 8) and fail2ban
<localfile>
<log_format>json</log_format>
<location>/opt/adguardhome/work/data/querylog.json</location>
<label key="source">adguard</label>
</localfile>
<localfile>
<log_format>syslog</log_format>
<location>/var/log/fail2ban.log</location>
<label key="source">fail2ban</label>
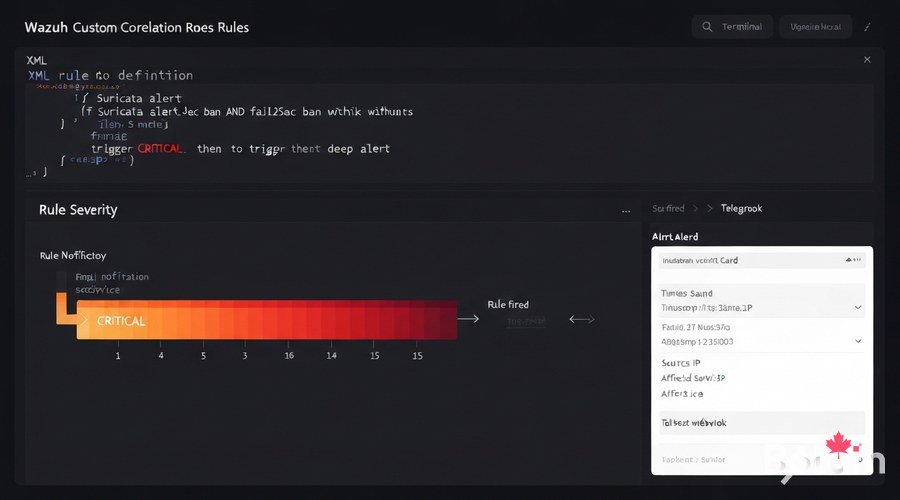
</localfile>Custom Correlation Rules
Correlation rules transform isolated events into detected incidents. Here's the BOTUM correlation rules file:
<!-- /var/ossec/etc/rules/botum_correlation.xml -->
<group name="botum_correlation,">

  <!-- Rule 1: Suricata + CrowdSec (same IP, 5-min window) -->
  <rule id="100100" level="12" timeframe="300" ignore="60">
    <if_matched_sid>86601</if_matched_sid>
    <same_field>data.src_ip</same_field>
    <description>CRITICAL: $(data.src_ip) — Suricata+CrowdSec simultaneous</description>
    <options>alert_by_email</options>
  </rule>

  <!-- Rule 2: SSH brute force (5 attempts / 2 min) -->
  <rule id="100101" level="10" frequency="5" timeframe="120">
    <if_matched_sid>5710</if_matched_sid>
    <same_field>data.srcip</same_field>
    <description>SSH brute force: $(data.srcip) — $(frequency)x/2min</description>
  </rule>

  <!-- Rule 3: DNS exfiltration (100 queries/min) -->
  <rule id="100102" level="8" frequency="100" timeframe="60">
    <if_matched_sid>82200</if_matched_sid>
    <same_field>data.client</same_field>
    <description>DNS exfil risk: $(frequency) queries/min — $(data.client)</description>
  </rule>

</group>
docker cp botum_correlation.xml wazuh-manager:/var/ossec/etc/rules/
docker exec wazuh-manager /var/ossec/bin/wazuh-control restartAlerting: Email and Telegram Webhook
<!-- ossec.conf manager — Email alerting -->
<global>
<email_notification>yes</email_notification>
<smtp_server>mail.botum.ca</smtp_server>
<email_from>wazuh@botum.ca</email_from>
<email_to>admin@yourdomain.com</email_to>
<email_maxperhour>20</email_maxperhour>
</global>
<alerts>
<log_alert_level>3</log_alert_level>
<email_alert_level>10</email_alert_level>
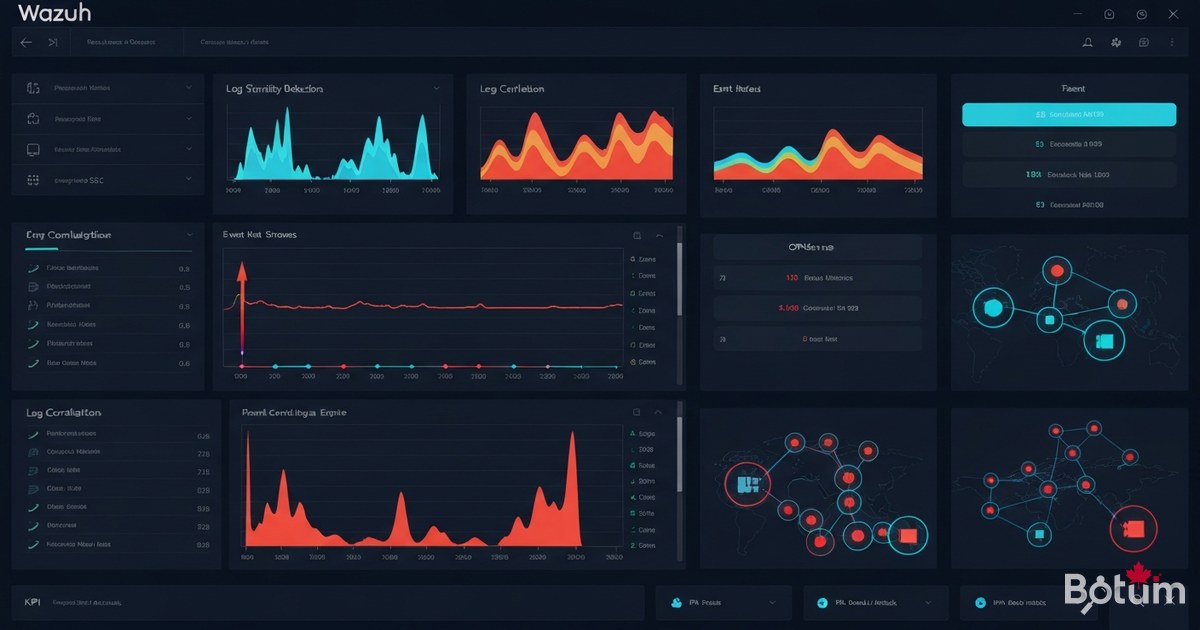
</alerts>Wazuh Dashboard: Unified Incident View
The Wazuh dashboard centralizes all stack events in a single interface. Key modules to enable:
- Security Events: all correlated events in real time
- Threat Intelligence: IOC via external threat feeds
- Integrity Monitoring: OPNsense filesystem monitoring
- Vulnerability Detection: CVE on installed packages (SCA)
- Compliance PCI/CIS: automated compliance reports
- MITRE ATT&CK: incident mapping on the ATT&CK framework
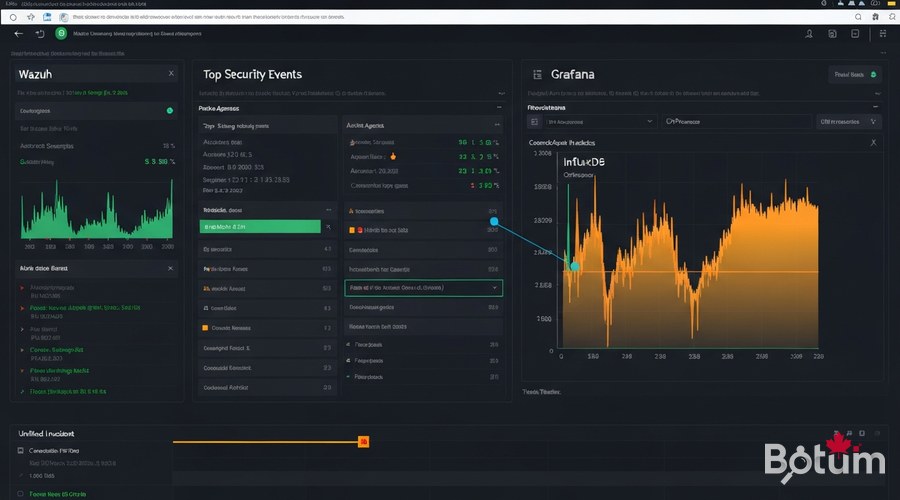
Connect with Grafana (Episode 9)
Wazuh (security) + Grafana (network metrics) = the perfect combination. I connect both via OpenSearch as a shared data source in Grafana:
# Grafana → Connections → Data Sources → Add → OpenSearch
# Host: https://192.168.X.X:9200
# Index: wazuh-alerts-4.x-*
# Time field: @timestamp
# Auth: admin / YourPassword

# Grafana annotations from Wazuh:
# Dashboard → Settings → Annotations → Add
# Query: rule.level:>=10 AND agent.name:"opnsense-fw"
# Result: critical alerts displayed as red vertical bars
# on InfluxDB traffic graphs — immediate visual correlation.
Conclusion and Next Steps
With Episode 11, the BOTUM stack has a complete SIEM layer: all security tools from previous episodes — Suricata, CrowdSec, AdGuard Home, fail2ban — are now correlated in a unified view with automated email and Telegram alerts.
- Episode 7 — Suricata IDS/IPS
- Episode 5 — CrowdSec + Fail2ban
- Episode 8 — AdGuard Home
- Episode 9 — Grafana + InfluxDB
- Episode 10 — CARP High Availability
- Episode 11 — Wazuh SIEM (this guide)
Next up (Episode 12): Ansible — reproducible, idempotent, Git-versioned stack provisioning. Deploy a fresh firewall in under 10 minutes, zero manual configuration.
See the full OPNsense Stack Series hub for all episodes.
Téléchargez ce guide en PDF pour le consulter hors ligne.
⬇ Télécharger le guide (PDF)🚀 Aller plus loin avec BOTUM
Ce guide couvre les bases. En production, chaque environnement a ses spécificités. Les équipes BOTUM accompagnent les organisations dans le déploiement, la configuration avancée et la sécurisation de leur infrastructure. Si vous avez un projet, parlons-en.
Discuter de votre projet →