Uptime Kuma: Free Self-Hosted Infrastructure Monitoring
Deploy Uptime Kuma to monitor all your self-hosted services 24/7 with Telegram, email and Discord alerts. Public status page included.
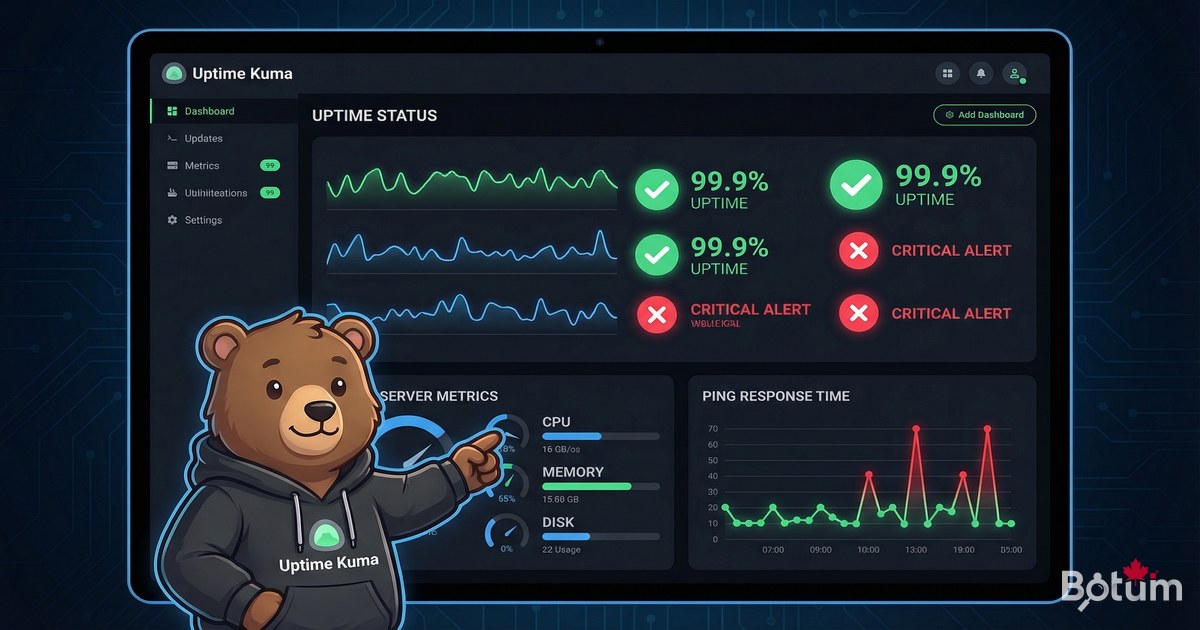
Uptime Kuma is the most elegant and easiest monitoring tool to deploy for self-hosted infrastructure. In minutes, you'll have a real-time view of the availability of all your services, with alerts via Telegram, email, or webhook.
Why Monitor Your Infrastructure?
Without monitoring, you discover your services are down when a user complains — or worse, when you need them yourself. Uptime Kuma alerts you immediately (within 60 seconds) when a service becomes unreachable, and gives you an accurate availability history.
- Outage detection in under 60 seconds
- Multi-channel alerts: Telegram, email, Slack, Discord, webhook
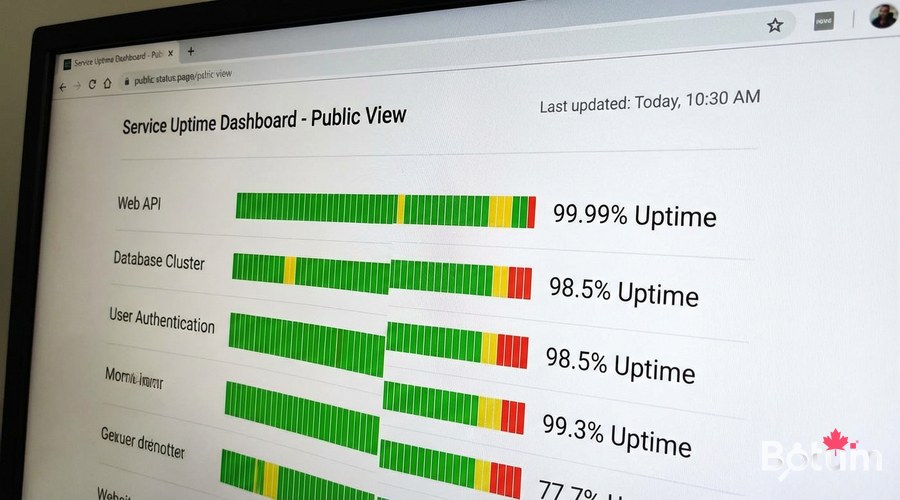
- Public status page (like statuspage.io but free)
- Availability history (uptime) over 30/60/90 days
- Monitors: HTTP/HTTPS, TCP, Ping, DNS, SSL certificate
- Response time and historical graphs
- Modern web interface — no agent to install on monitored servers

Deploy Uptime Kuma with Docker
mkdir -p ~/docker/uptime-kuma && cd ~/docker/uptime-kuma

cat > docker-compose.yml << 'EOF'
version: '3.8'

services:
  uptime-kuma:
    image: louislam/uptime-kuma:latest
    container_name: uptime-kuma
    restart: unless-stopped
    ports:
      - "3000:3001"    # Generic port — web interface on 3000
    volumes:
      - ./data:/app/data
      - /var/run/docker.sock:/var/run/docker.sock:ro  # Optional: Docker monitoring
    environment:
      - TZ=America/Toronto
EOF

docker compose up -d
docker logs -f uptime-kuma
Access the interface at http://server-IP:3000. On first access, create an administrator account. Then configure Zoraxy to expose Uptime Kuma via HTTPS: status.yourdomain.com -> localhost:3000.
Create Your First Monitors
In the Uptime Kuma interface, click '+ Add New Monitor'. Here are the most useful monitor types:
# HTTP/HTTPS Monitor (most common):
# Type: HTTP(s)
# Friendly Name: Ghost Blog
# URL: https://blog.yourdomain.com
# Heartbeat Interval: 60 seconds
# Retries before down: 3
# Max redirects: 10

# TCP Monitor (open port):
# Type: TCP Port
# Friendly Name: SSH Server
# Host: 192.168.1.100
# Port: 22
# Interval: 60 seconds

# Ping Monitor:
# Type: Ping
# Friendly Name: Router
# Host: 192.168.1.1
# Interval: 30 seconds

# SSL Certificate Monitor:
# Type: HTTP(s) with "Check SSL/TLS Certificate" enabled
# Alert if certificate expires in less than 14 days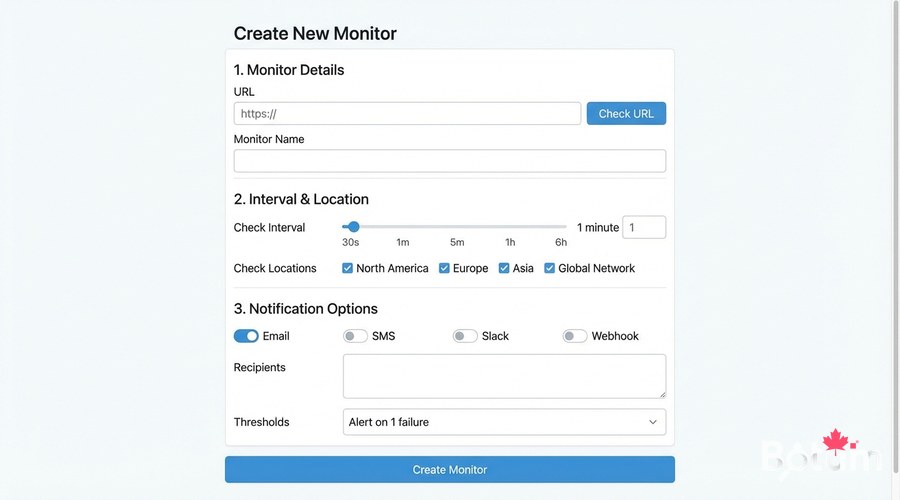
Telegram Alert Configuration
Uptime Kuma supports over 90 integrations. Here's how to configure Telegram alerts (the most convenient method):
# 1. Create a Telegram bot:
#    - Open Telegram > search @BotFather
#    - /newbot > give a name and username
#    - Copy the API token (e.g., 123456:ABC-DEF...)

# 2. Get your Chat ID:
#    - Send a message to your bot
#    - Go to: https://api.telegram.org/bot<TOKEN>/getUpdates
#    - Find "chat":{"id": YOUR_CHAT_ID}

# 3. In Uptime Kuma:
#    - Settings > Notifications > Add Notification
#    - Type: Telegram
#    - Bot Token: your-bot-token
#    - Chat ID: your-chat-id
#    - Test Notification
#    - Save
Email Alert Configuration
# In Uptime Kuma:
# Settings > Notifications > Add Notification
# Type: Email (SMTP)

# SMTP configuration:
# SMTP Host: smtp.gmail.com (or your SMTP server)
# SMTP Port: 587 (TLS) or 465 (SSL)
# SMTP Username: your-email@gmail.com
# SMTP Password: gmail-app-password
# From: monitoring@yourdomain.com
# To: alerts@yourdomain.com
# Security: TLS
# Test > Save
Create a Public Status Page
A status page lets your clients or users see the state of your services. In Uptime Kuma > Status Pages > New Status Page:
- Title: Service Status — YourName
- Slug: status (accessible at https://status.yourdomain.com/status)
- Description: Real-time status of our services
- Select monitors to display
- Customize colors and logo
- Enable incidents and scheduled maintenance
Advanced Monitors — DNS, Docker, and API
# DNS Monitor (verify domain resolves correctly):
# Type: DNS
# Hostname: yourdomain.com
# Resolver Server: 8.8.8.8
# Record Type: A
# Expected Value: your-public-IP

# JSON Query Monitor (API/webhook):
# Type: HTTP(s) - Keyword
# URL: https://api.yourservice.com/health
# Keyword to check: "status":"ok"
# Purpose: verify an API endpoint returns the correct status

# Docker Monitor (running container):
# (Requires /var/run/docker.sock mounted)
# Type: Docker Container
# Container Name/ID: ghost-blog
Maintenance and Updates
# Update Uptime Kuma
cd ~/docker/uptime-kuma
docker compose pull
docker compose up -d

# Backup data
tar czf uptime-kuma-backup-$(date +%Y%m%d).tar.gz ./data/

# Check database size (SQLite)
ls -lh ./data/kuma.db

# View logs
docker logs --tail 100 uptime-kuma
Conclusion and Next Steps
Uptime Kuma now monitors your entire infrastructure 24/7 and alerts you immediately on failure. In the next article, we'll see how to automate your Linux infrastructure with crons, bash scripts, and alerts — to make monitoring proactive rather than reactive.
Téléchargez ce guide en PDF pour le consulter hors ligne.
⬇ Télécharger le guide (PDF)🚀 Aller plus loin avec BOTUM
Ce guide couvre les bases. En production, chaque environnement a ses spécificités. Les équipes BOTUM accompagnent les organisations dans le déploiement, la configuration avancée et la sécurisation de leur infrastructure. Si vous avez un projet, parlons-en.
Discuter de votre projet →