OPNsense Monitoring with Grafana and InfluxDB: Real-Time Dashboards
Deploy a real-time monitoring stack for OPNsense using Telegraf, InfluxDB 2.x, and Grafana on Docker/Proxmox. WAN/VLAN/VPN dashboards, Telegram alerting, Suricata and AdGuard Home integration — total visibility over your infrastructure.
Why Monitor Your Firewall?
A firewall without monitoring is like driving blindfolded. In my BOTUM infrastructure, I learned the hard way that the most costly network issues are the ones you don't see coming: a silent WAN saturation at 3am, an intrusion attempt slipping through the cracks, an IoT VLAN generating 10x its normal traffic.
Real-time monitoring with Grafana + InfluxDB gives me three essential capabilities:
- Full visibility: see in real-time what crosses each interface, VLAN, and VPN tunnel.
- Anomaly detection: identify abnormal patterns — traffic spikes, DNS floods, connections to suspicious IPs.
- SLA compliance: prove uptime, document network incidents, measure WAN latency.
This is the 9th and final episode of the OPNsense Stack Series. You already have the firewall, VLANs, VPN, WiFi, IDS/IPS protection, NAC, and DNS. Now you get the eyes.
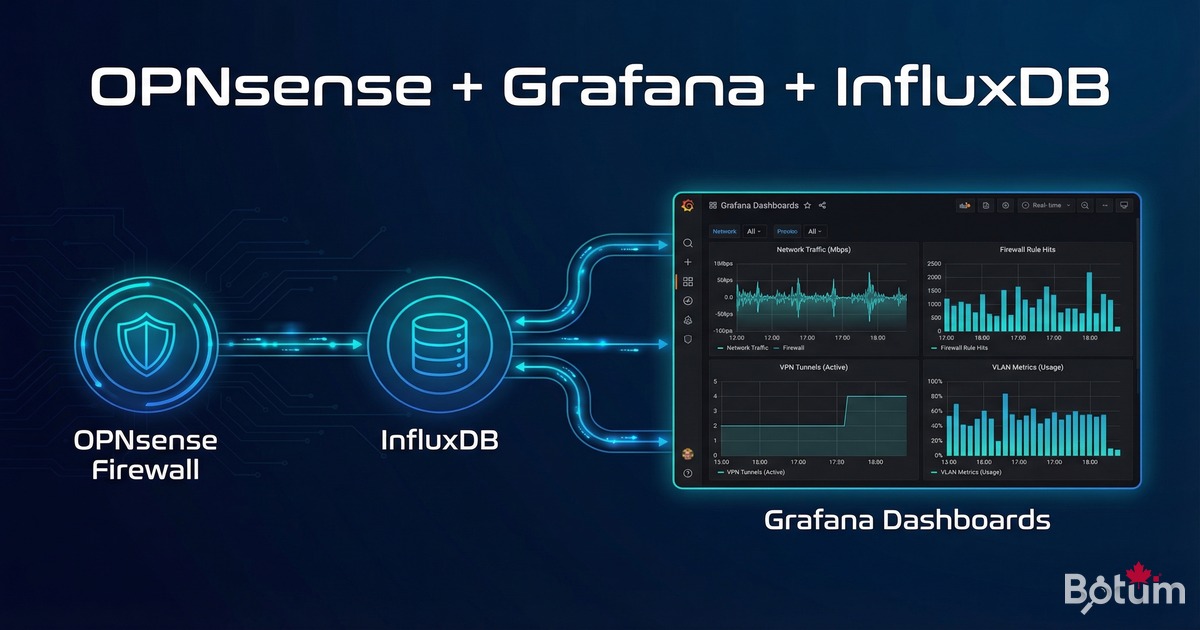
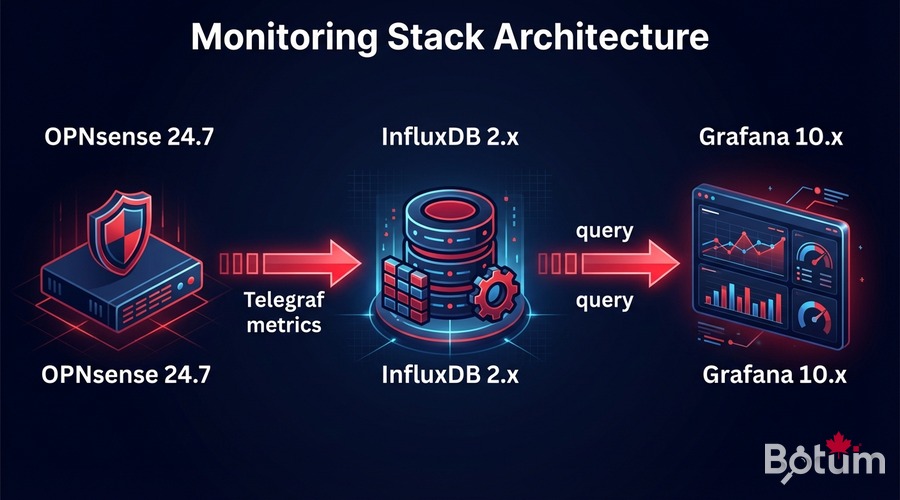
Monitoring Stack Architecture
The stack I use is simple and battle-tested:
OPNsense (raw metrics)
     ↓  os-telegraf plugin (collection)
Telegraf (metrics agent)
     ↓  HTTP/UDP to port 8086
InfluxDB 2.x (time-series database)
     ↓  Grafana data source
Grafana (visualization + alerting)
     ↓  notifications
Email / Telegram / Slack
Each component runs in a Docker container on a dedicated Proxmox VM. I allocate 2 vCPUs + 2 GB RAM — more than enough for infrastructure handling up to 1 Gbps of aggregated traffic.
Enable InfluxDB Export in OPNsense
Install the os-telegraf Plugin
# In OPNsense: System > Firmware > Plugins
# Search "telegraf" and install: os-telegraf

# Or via SSH in OPNsense:
pkg install os-telegraf
Configure Telegraf in OPNsense
# Services > Telegraf > General
# Check: Enable Telegraf
# InfluxDB URL: http://PROXMOX-IP:8086
# Token: (generated in InfluxDB)
# Bucket: opnsense
# Organization: botum

# Enable collectors:
# ✓ Interfaces (traffic per interface)
# ✓ Firewall (rules, states)
# ✓ CPU / Memory / Disk
# ✓ Gateway (WAN latency)
Advanced telegraf.conf Configuration
[agent]
  interval = "10s"
  flush_interval = "10s"

[[inputs.net]]
  interfaces = ["em0", "vtnet0", "igc0"]

[[inputs.cpu]]
  totalcpu = true

[[inputs.mem]]

[[inputs.system]]

[[inputs.netstat]]

[[outputs.influxdb_v2]]
  urls = ["http://192.168.1.x:8086"]
  token = "YOUR-INFLUXDB-TOKEN"
  organization = "botum"
  bucket = "opnsense"
  timeout = "5s"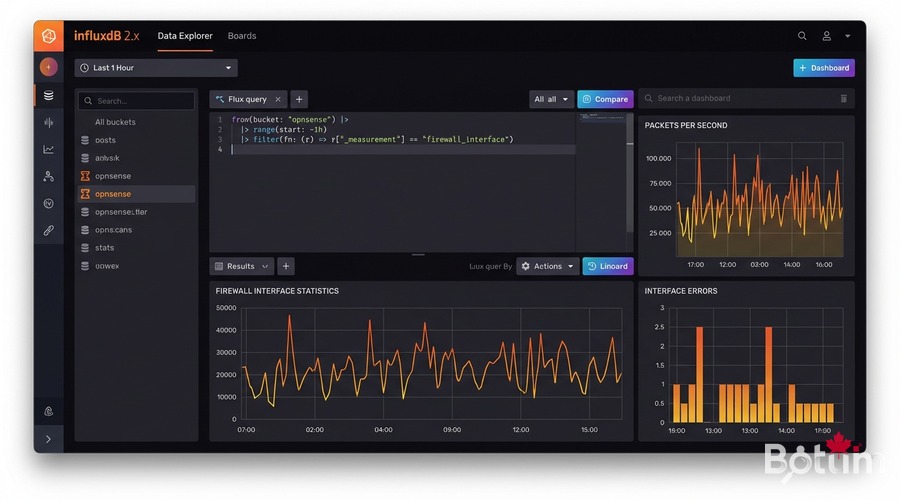
Install InfluxDB 2.x in Docker on Proxmox
Docker Compose — Full Monitoring Stack
mkdir -p /opt/monitoring/{influxdb,grafana}
cd /opt/monitoring

cat > docker-compose.yml << 'EOF'
version: '3.8'

services:
  influxdb:
    image: influxdb:2.7
    container_name: influxdb
    restart: unless-stopped
    ports:
      - "8086:8086"
    volumes:
      - ./influxdb/data:/var/lib/influxdb2
      - ./influxdb/config:/etc/influxdb2
    environment:
      DOCKER_INFLUXDB_INIT_MODE: setup
      DOCKER_INFLUXDB_INIT_USERNAME: admin
      DOCKER_INFLUXDB_INIT_PASSWORD: BotumSecure2026!
      DOCKER_INFLUXDB_INIT_ORG: botum
      DOCKER_INFLUXDB_INIT_BUCKET: opnsense
      DOCKER_INFLUXDB_INIT_RETENTION: 90d

  grafana:
    image: grafana/grafana:latest
    container_name: grafana
    restart: unless-stopped
    ports:
      - "3000:3000"
    volumes:
      - ./grafana:/var/lib/grafana
    environment:
      GF_SECURITY_ADMIN_PASSWORD: BotumSecure2026!
      GF_INSTALL_PLUGINS: grafana-clock-panel,grafana-worldmap-panel
    depends_on:
      - influxdb

EOF

docker compose up -d
echo "InfluxDB: http://PROXMOX-IP:8086"
echo "Grafana:  http://PROXMOX-IP:3000"
Generate InfluxDB Token
# Via InfluxDB web UI (http://IP:8086)
# Load Data > API Tokens > Generate API Token > All Access
# Copy the token (88-char string)

# Or via CLI:
docker exec influxdb influx auth create   --org botum   --all-access   --description "Telegraf OPNsense"
⚠️ Store the token in your secrets manager (Vaultwarden). It will only be displayed once.
Configure Grafana with InfluxDB
Add InfluxDB Data Source
# Grafana → Configuration > Data Sources > Add Data Source
# Select: InfluxDB
# Query Language: Flux (for InfluxDB 2.x)
# URL: http://influxdb:8086
# Organization: botum
# Token: YOUR-TOKEN
# Default Bucket: opnsense
# Save & Test → "datasource is working. 1 buckets found"
Basic Flux Query — WAN Traffic
from(bucket: "opnsense")
  |> range(start: -1h)
  |> filter(fn: (r) => r._measurement == "net")
  |> filter(fn: (r) => r.interface == "em0")
  |> filter(fn: (r) => r._field == "bytes_recv" or r._field == "bytes_sent")
  |> derivative(unit: 1s, nonNegative: true)
  |> map(fn: (r) => ({ r with _value: r._value * 8.0 }))
  |> aggregateWindow(every: 30s, fn: mean, createEmpty: false)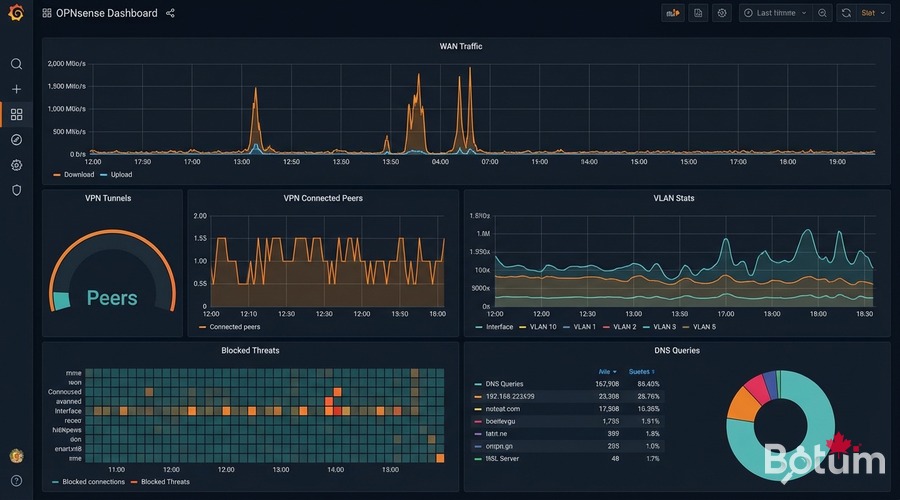
Import OPNsense Dashboards
The Grafana community offers excellent pre-built dashboards for OPNsense:
- OPNsense Overview (ID: 13713) — WAN traffic, CPU, memory, firewall states, gateways
- OPNsense Interfaces (ID: 14966) — Throughput per interface, errors, packets/sec
- OPNsense Firewall Rules (ID: 15413) — Rule hits, blocked connections, IP geolocation
- VLAN Traffic (custom) — Traffic per VLAN, top clients, anomalies
- OPNsense VPN WireGuard (custom) — Connected peers, traffic per tunnel, latency
# Import via Grafana UI:
# Dashboards > Import > Dashboard ID
# Dashboard ID 13713 → OPNsense Overview
# Data Source = InfluxDB (opnsense)

# Dashboard variables:
# Bucket: opnsense
# WAN interfaces: em0, vtnet0
# LAN/VLAN interfaces: vtnet1, vtnet2, vtnet3...
Grafana Alerting: Bandwidth and Suspicious Connections
Configure a Telegram Contact Point
# Grafana → Alerting > Contact Points > Add Contact Point
# Type: Telegram
# Bot Token: your Telegram Bot Token
# Chat ID: your Chat ID
# Test → Telegram message received ✓
Alert — WAN Bandwidth Saturation
# Flux query:
from(bucket: "opnsense")
  |> range(start: -5m)
  |> filter(fn: (r) => r._measurement == "net" and r.interface == "em0")
  |> filter(fn: (r) => r._field == "bytes_sent" or r._field == "bytes_recv")
  |> derivative(unit: 1s, nonNegative: true)
  |> map(fn: (r) => ({ r with _value: r._value * 8.0 }))
  |> sum()

# Condition: avg() > 900000000 (900 Mbps) for 2 minutes
# Alert → Telegram: "WAN saturation detected"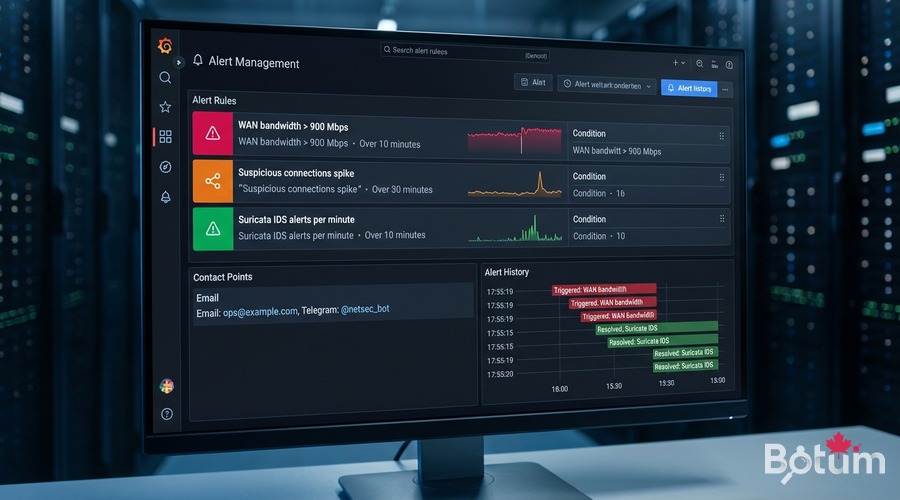
Alert — Suspicious Connections Spike
from(bucket: "opnsense")
  |> range(start: -10m)
  |> filter(fn: (r) => r._measurement == "pf_state")
  |> filter(fn: (r) => r._field == "count")
  |> derivative(unit: 1m, nonNegative: true)
  |> mean()

# Condition: mean() > 5000 connections/min
# Calibrate based on 1 week of normal traffic observation
Integrate Suricata and AdGuard Home into Grafana
Suricata Logs via Loki
# Add to docker-compose.yml:
  loki:
    image: grafana/loki:latest
    container_name: loki
    restart: unless-stopped
    ports:
      - "3100:3100"

  promtail:
    image: grafana/promtail:latest
    container_name: promtail
    volumes:
      - /var/log:/var/log:ro
      - ./promtail-config.yml:/etc/promtail/config.yml

# OPNsense: enable Suricata EVE JSON logs
# Intrusion Detection > Administration > Log to syslog: ON

# promtail-config.yml:
scrape_configs:
  - job_name: suricata
    static_configs:
      - targets: [localhost]
        labels:
          job: suricata
          __path__: /var/log/suricata/*.json
AdGuard Home Metrics via REST API
# Telegraf integration:
[[inputs.http]]
  urls = ["http://192.168.1.x:3000/control/stats"]
  method = "GET"
  username = "admin"
  password = "YOUR-PASSWORD"
  data_format = "json"
  name_suffix = "_adguard"

# Grafana query:
from(bucket: "opnsense")
  |> range(start: -24h)
  |> filter(fn: (r) => r._measurement == "http_adguard")
  |> filter(fn: (r) => r._field == "dns_queries" or r._field == "blocked_filters")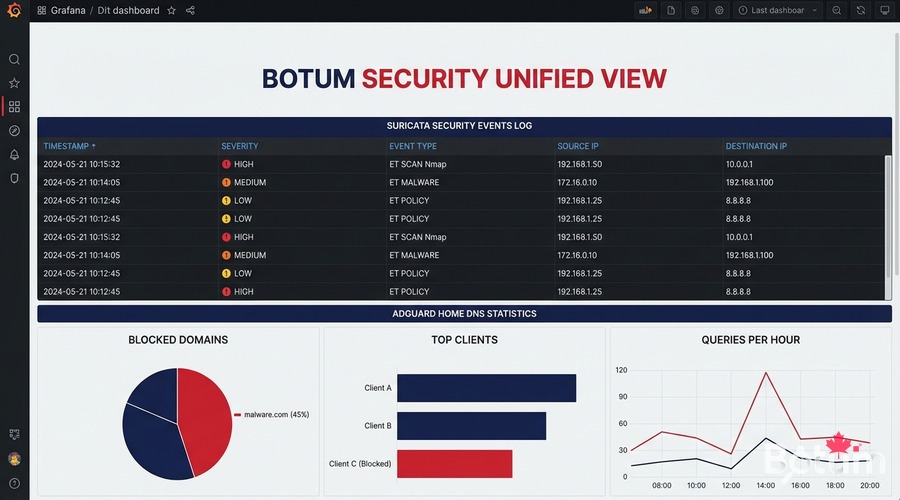
Conclusion: Full Series Recap
We've reached the end of 9 episodes building a complete enterprise-grade network infrastructure on OPNsense + Proxmox. Here's what you have:
- Episode 1 — OPNsense on Proxmox: High-performance firewall VM, virtual network interfaces
- Episode 2 — Zero-Trust VLANs: Network segmentation: LAN, IoT, DMZ, Guest — full isolation
- Episode 3 — WireGuard VPN + LTE SD-WAN: Site-to-site VPN, remote workers, 4G failover
- Episode 4 — WiFi + UniFi AP: WiFi AP management, wireless VLAN isolation, captive portal
- Episode 5 — CrowdSec + Fail2ban: Collaborative protection, dynamic blocklists, IP banning
- Episode 6 — NAC FreeRADIUS 802.1X: Network authentication, certificates, identity-based access
- Episode 7 — Suricata IDS/IPS + DPI: Intrusion detection, inline prevention, deep packet inspection
- Episode 8 — AdGuard Home + DoH: DNS filtering, blocklists, DNS over HTTPS
- Episode 9 — Grafana + InfluxDB (you are here): Real-time monitoring, dashboards, alerting
This stack gives you enterprise-grade network infrastructure that most $50K/year network-budget SMEs don't have — for under $500 in hardware and $0 in software licenses.
Next up: the OpenClaw Series — infrastructure automation, intelligent agents, self-healing networks. Stay tuned.
🔗 Series Hub: OPNsense Enterprise Security Stack on Proxmox
Téléchargez ce guide en PDF pour le consulter hors ligne.
⬇ Télécharger le guide (PDF)🚀 Aller plus loin avec BOTUM
Ce guide couvre les bases. En production, chaque environnement a ses spécificités. Les équipes BOTUM accompagnent les organisations dans le déploiement, la configuration avancée et la sécurisation de leur infrastructure. Si vous avez un projet, parlons-en.
Discuter de votre projet →